Introduction
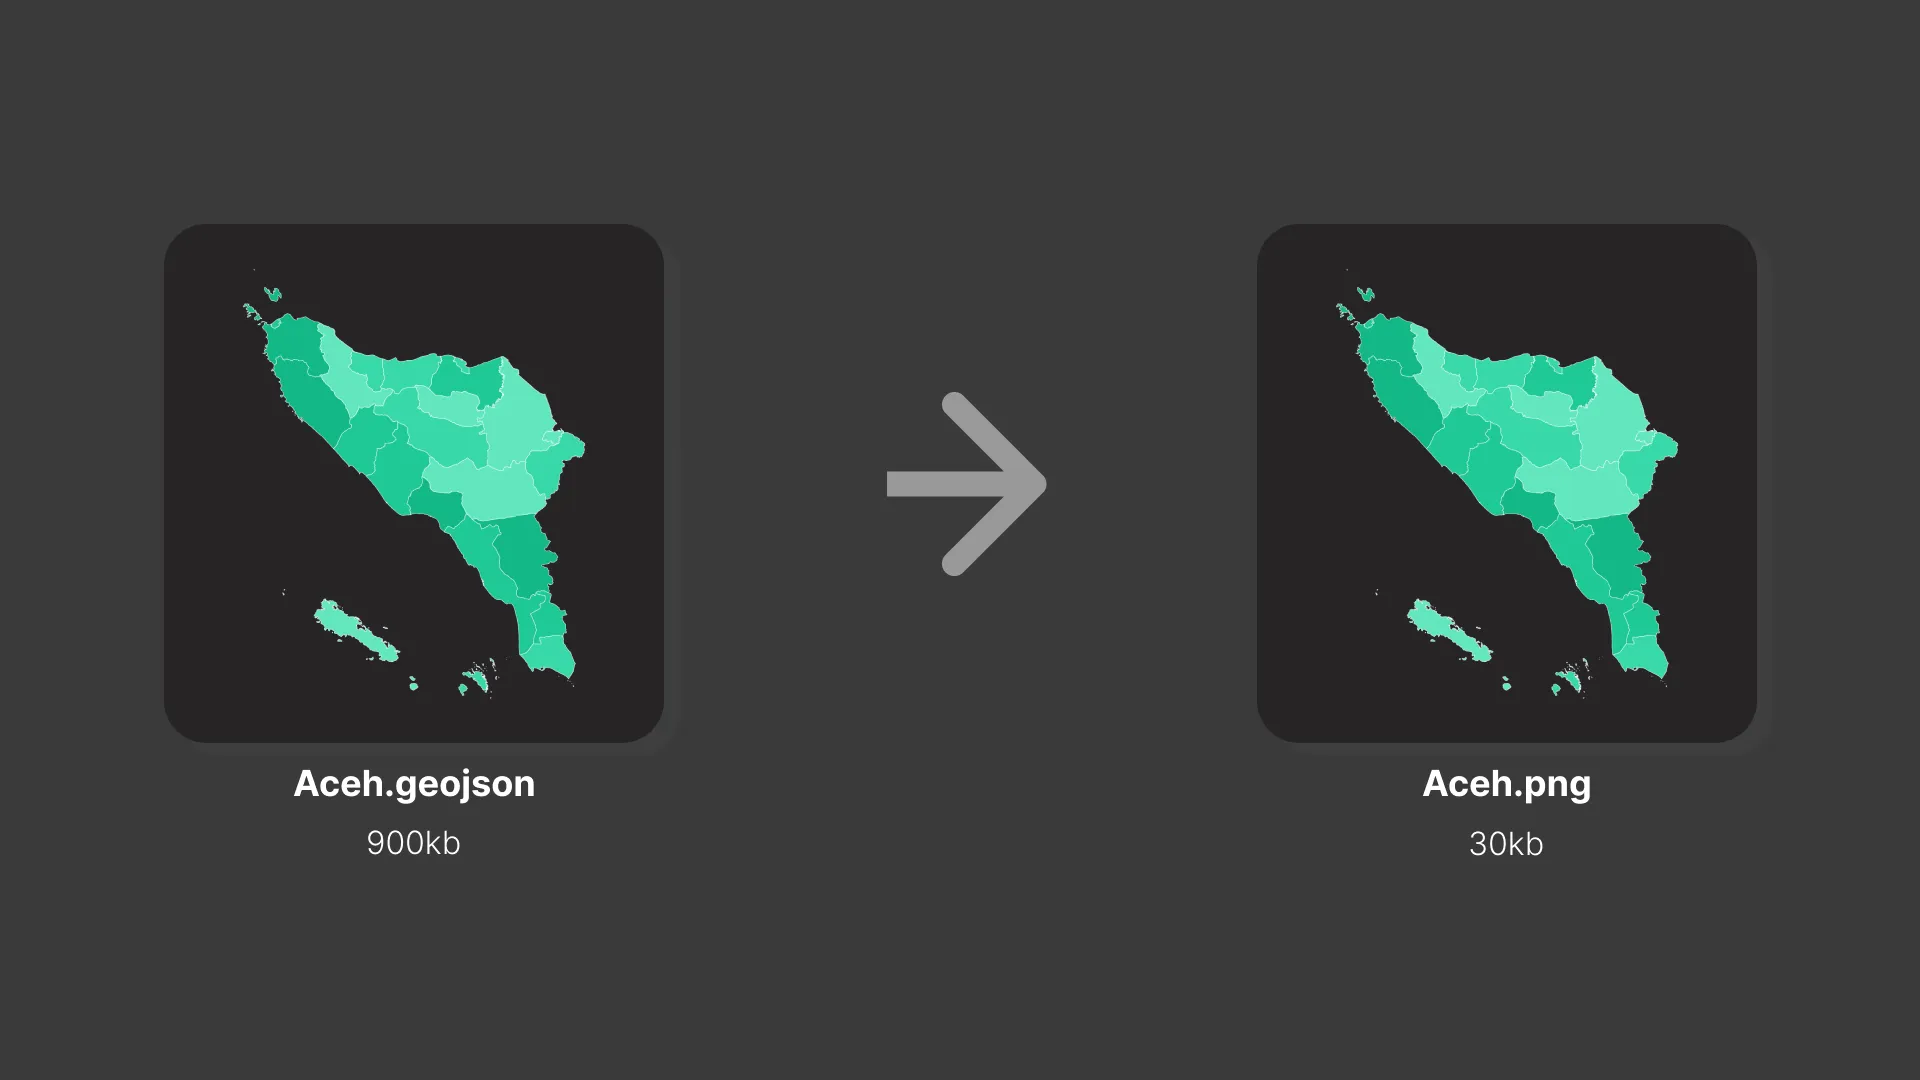
I have project to show thumbnail of maps from a hundreds GeoJSON files, and this is not efficient if we send geoJSON data to our client (web apps in this case). GeoJSON has a bigger size than png image in small resolution, especially for GeoJSON that has some detailed information.
We generate images from GeoJSON files on the server and send it to the client. This method makes more sense if you want to show a lot of maps without interaction, like thumbnail.
- We don’t need to use library like leaflet or mapbox to show thumbnail, just show it like any others image.
- Serve PNG is more efficient than GeoJSON because for small resoulution png has smaller size than GeoJSON files.
Coding
To begin, first you need to create a new node.js project, and install following package
npm install d3 jsdom sharpd3 and jsdom to render svg maps from geoJSON files on the server, and sharp to convert svg to png. I am settings this project to module in package.json so I can use import statements, or use require otherwise.
import sharp from "sharp";
import { JSDOM } from "jsdom";
import { promises as fs } from "fs";
import { select, geoPath, geoMercator } from "d3";

const removeExtension = str => str.split(".").slice(0, -1).join(".");

const createGeoJSONImage = async filename => {
  const WIDTH = 256;

  const HEIGHT = 256;

  const COLORS = ["#63e6be", "#38d9a9", "#20c997", "#12b886"];

  let geoJSON;
  try {
    geoJSON = JSON.parse(await fs.readFile(filename, "utf8"));
  } catch (error) {
    console.log(error);
    return 0;
  }

  const window = new JSDOM(undefined, { pretendToBeVisual: true }).window;

  window.d3 = select(window.document);

  const svg = window.d3
    .select("body")
    .append("div")
    .attr("class", "container")
    .append("svg")
    .attr("xmlns", "http://www.w3.org/2000/svg")
    .attr("width", WIDTH)
    .attr("height", HEIGHT)
    .append("g");

  const projection = geoMercator().fitSize([WIDTH, HEIGHT], {
    type: "FeatureCollection",
    features: geoJSON.features,
  });

  const geoGenerator = geoPath().projection(projection);

  svg
    .selectAll("path")
    .data(geoJSON.features)
    .join("path")
    .attr("d", geoGenerator)
    .attr("fill", (d, i) => COLORS[i % 4])
    .attr("stroke", "#fff");

  await sharp(Buffer.from(window.d3.select(".container").html()))
    .png()
    .toFile(`${removeExtension(filename)}.png`);
};
Let’s breakdown the code above. that code generate a choropleth from geoJSON. First of all we set jsdom to show d3 svg element. It’s like we create a simple HTML dom, but this is programtically with jsDOM.
// .... rest of code

const window = new JSDOM(undefined, { pretendToBeVisual: true }).window;

window.d3 = select(window.document);

const svg = window.d3
  .select("body")
  .append("div")
  .attr("class", "container")
  .append("svg")
  .attr("xmlns", "http://www.w3.org/2000/svg")
  .attr("width", WIDTH)
  .attr("height", HEIGHT)
  .append("g");

// .... rest of code
next step we show the geoJSON files to mercator projection using d3.js. You can use other projection, but you need to experiment by yourself to get better result.
// .... rest of code

const projection = geoMercator().fitSize([WIDTH, HEIGHT], {
  type: "FeatureCollection",
  features: geoJSON.features,
});

const geoGenerator = geoPath().projection(projection);

// .... rest of code
Then we show our projection of GeoJSON files to svg dom we created before.
// .... rest of code

svg
  .selectAll("path")
  .data(geoJSON.features)
  .join("path")
  .attr("d", geoGenerator)
  .attr("fill", (d, i) => COLORS[i % 4])
  .attr("stroke", "#fff");

// .... rest of code
In that code I am using simple rule .attr('fill', (d, i) => COLORS[i % 4]) to create add color for each features. You can create your function to make it more beautiful choropleth maps, e.g with some geojson properties (You can access geoJSON properties from d.properties.properties_name). The last step, we save svg dom to png using sharp.
To generate multiple GeoJSON files, just create script to run the function automatically. You can read all GeoJSON files from a folder then run the script.
Drawbacks
Sometimes you can’t get best result when generating image from GeoJSON. In my case, D3 can’t render some specific GeoJSON features that too small to render, and I must search and remove manually (using QGIS) that specific features.
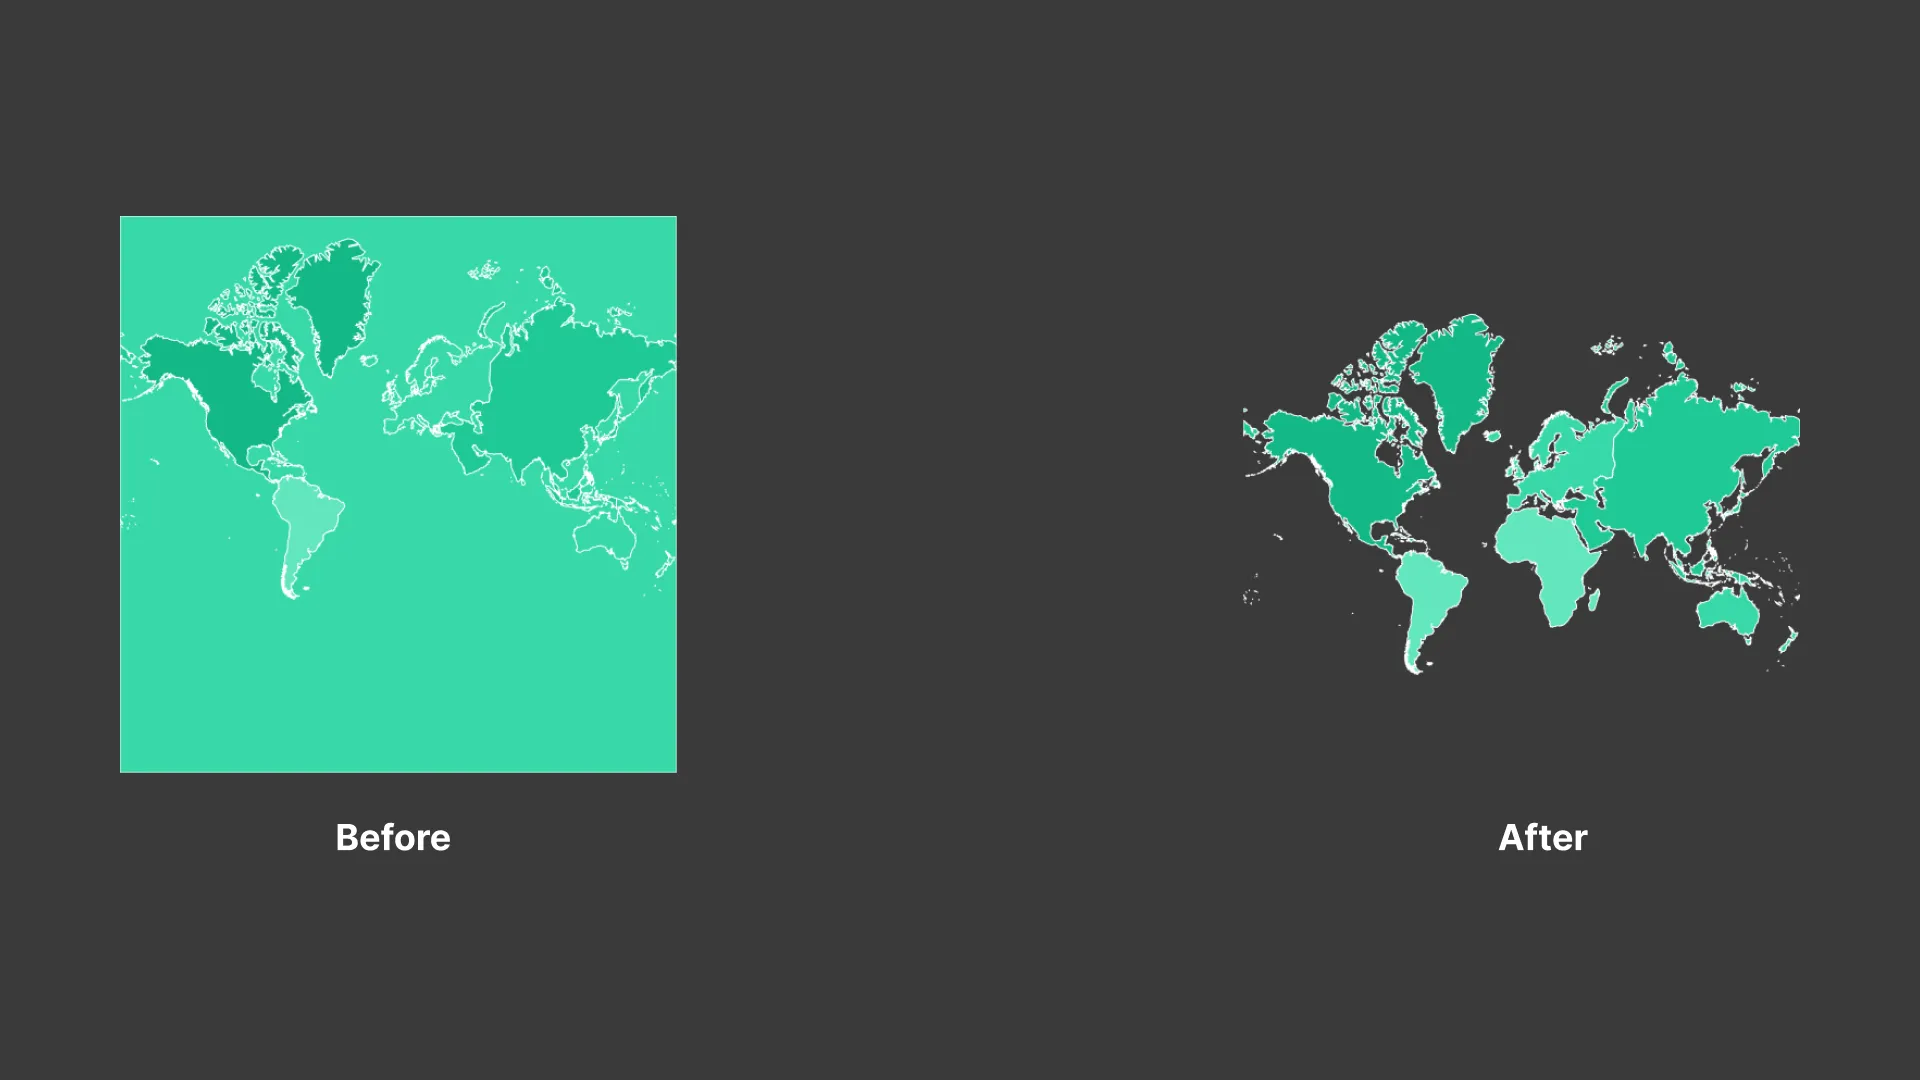
In my example, I want to make continent images from geoJSON. You can see, Affrica does not exist, so I edited to remove some fetures with QGIS and run the script again and I get the best result. The trickiest part is find the feature that cause this happen, sometimes I export to svg to find that features.
Conclusion
This method is useful for generating a lot of images from GeoJSON files, result file will be smaller than raw geojson. You can use it to another use case. You can get all the code and example from this link